57 Retail Crime & Theft Statistics You Need To Know
DealAid curates retail theft and crime statistics in the United States from government data, non-profit organizations and other sources. This report includes data on organized retail crime, retail theft by state, retail theft by city, internal retail theft and retail loss prevention. Please refer to the footnotes for original data sources.
*This resource was updated on September 27th, 2023 with latest retail theft and organized retail crime data.
Key Retail Theft Statistics
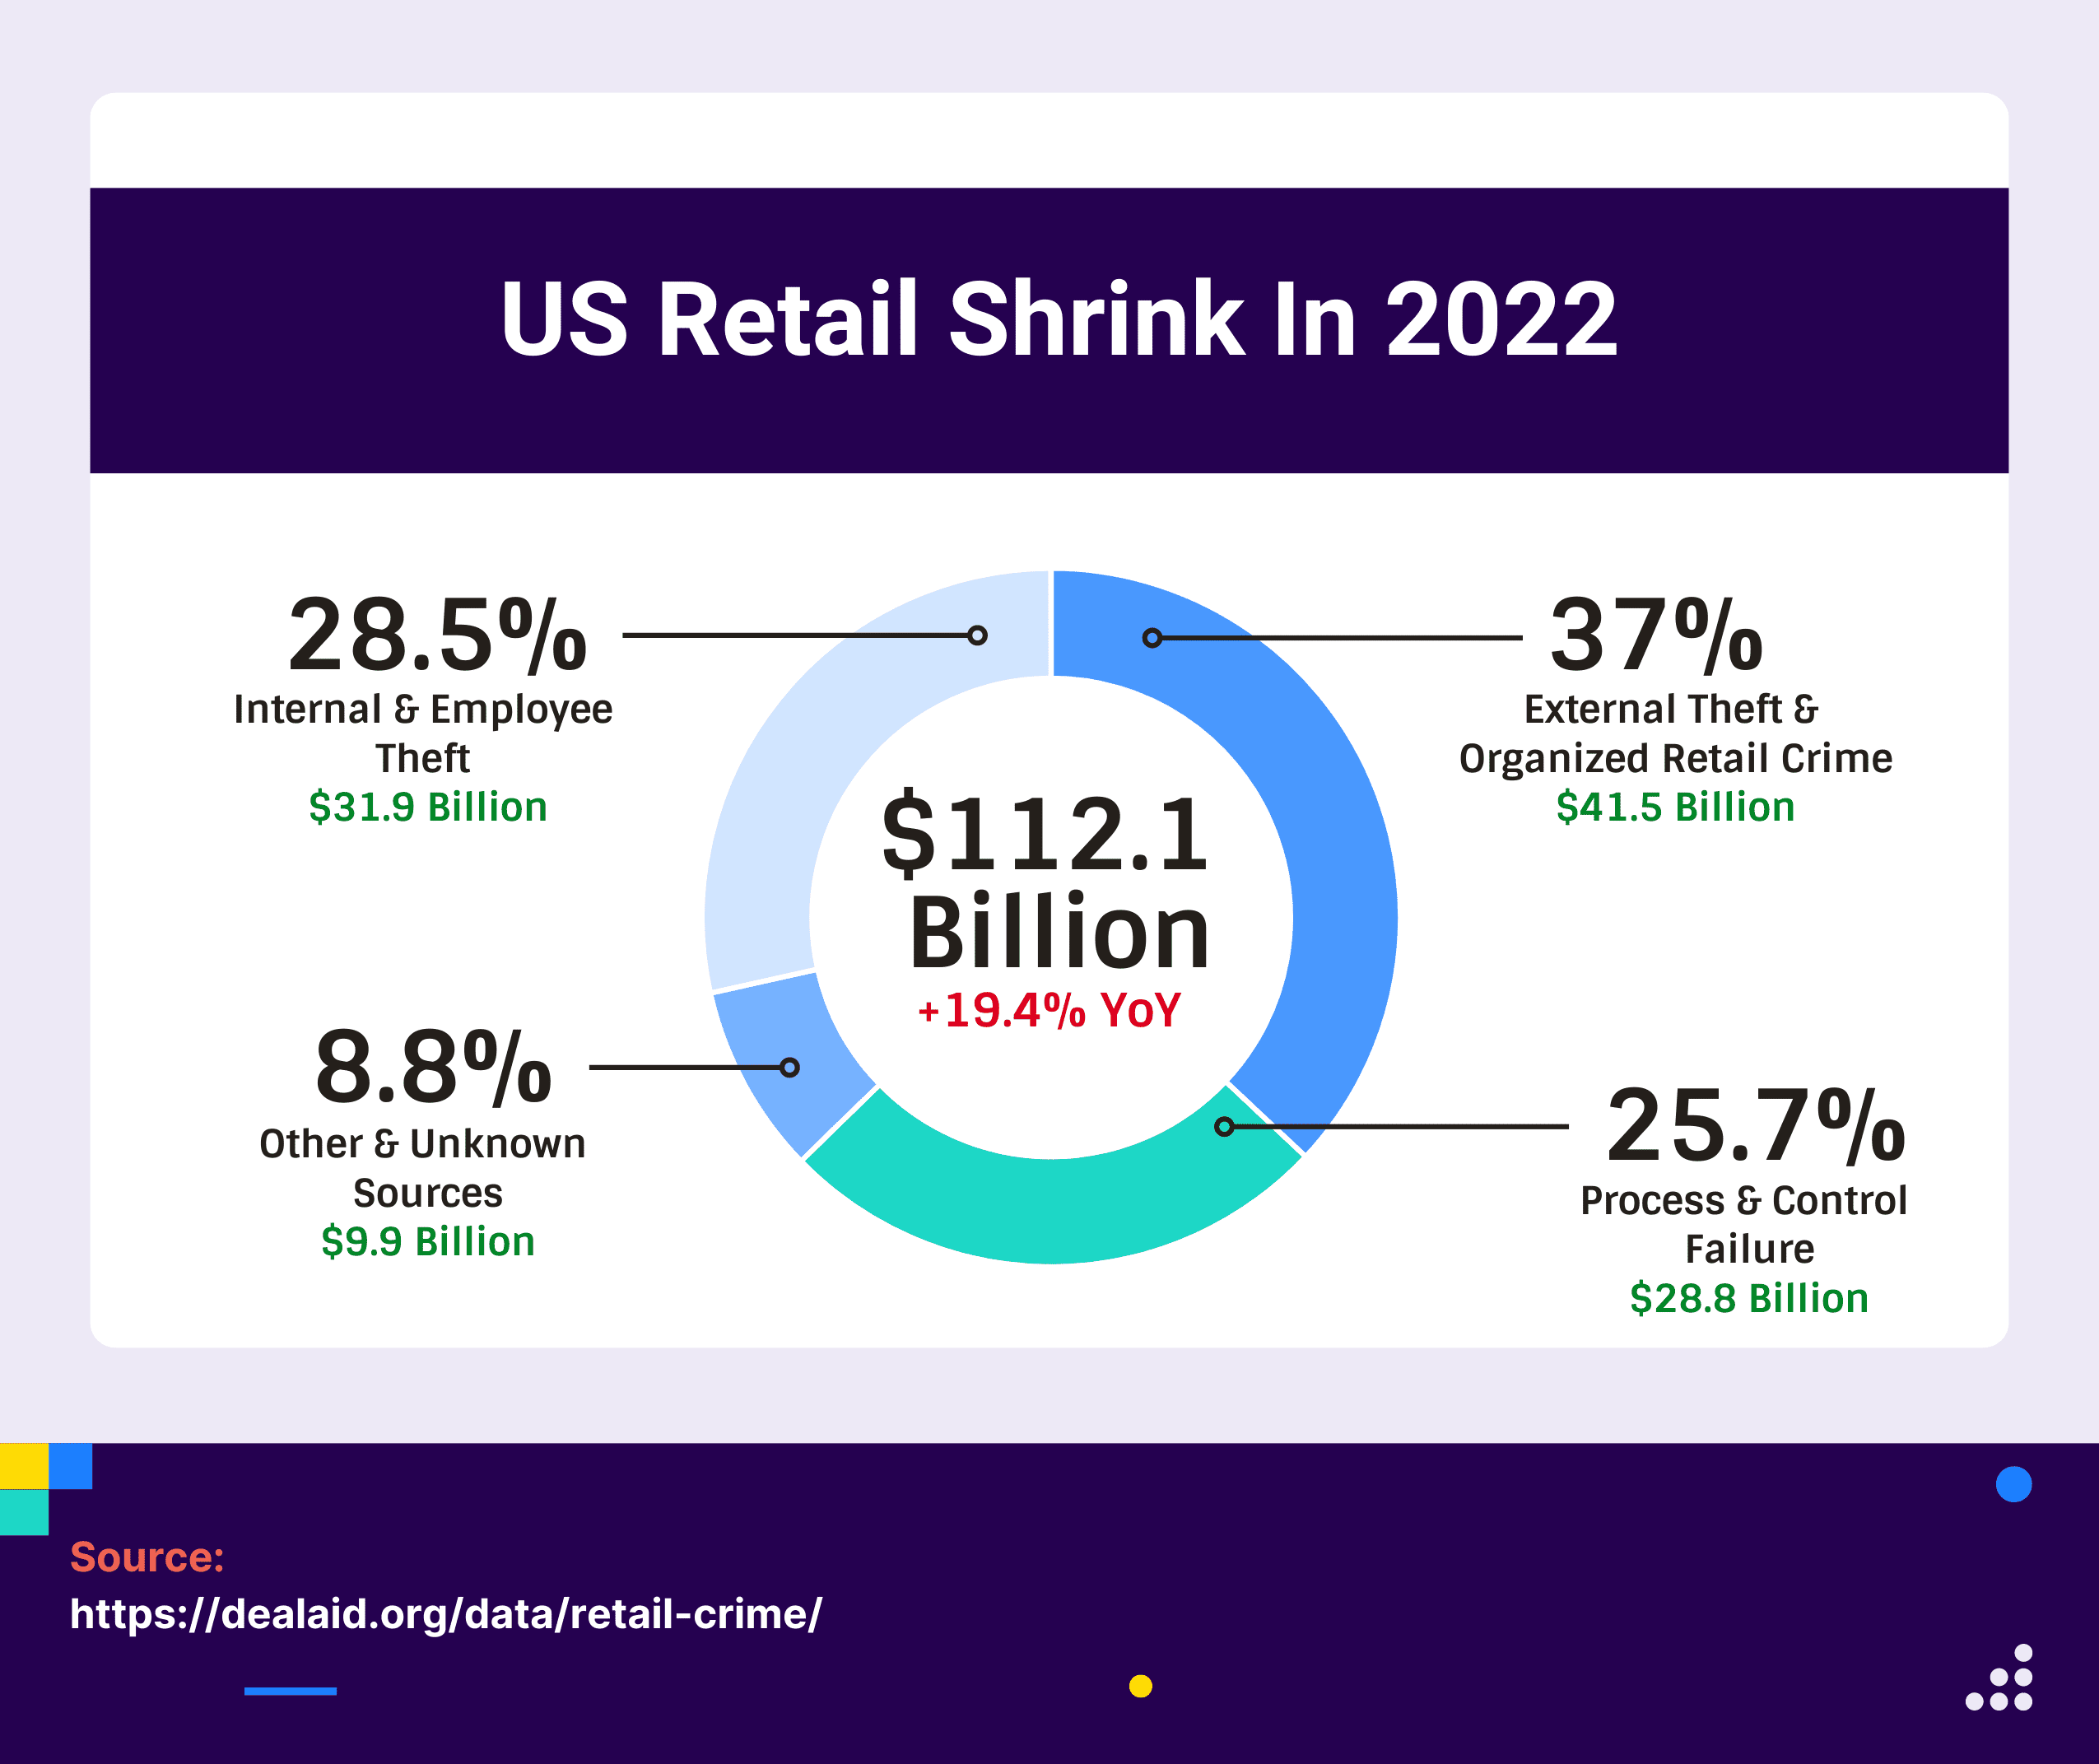
Total retail shrink in US was $112.1 billion in 2022.
Retail shrink in US increased by 19.4% in 2022 versus 2021 when it was $93.9 billion.
Average loss per shoplifting incident was $514.71 in 2022.
Shoplifting accounts for 21.3% of all larceny-theft cases in US over the last five years.
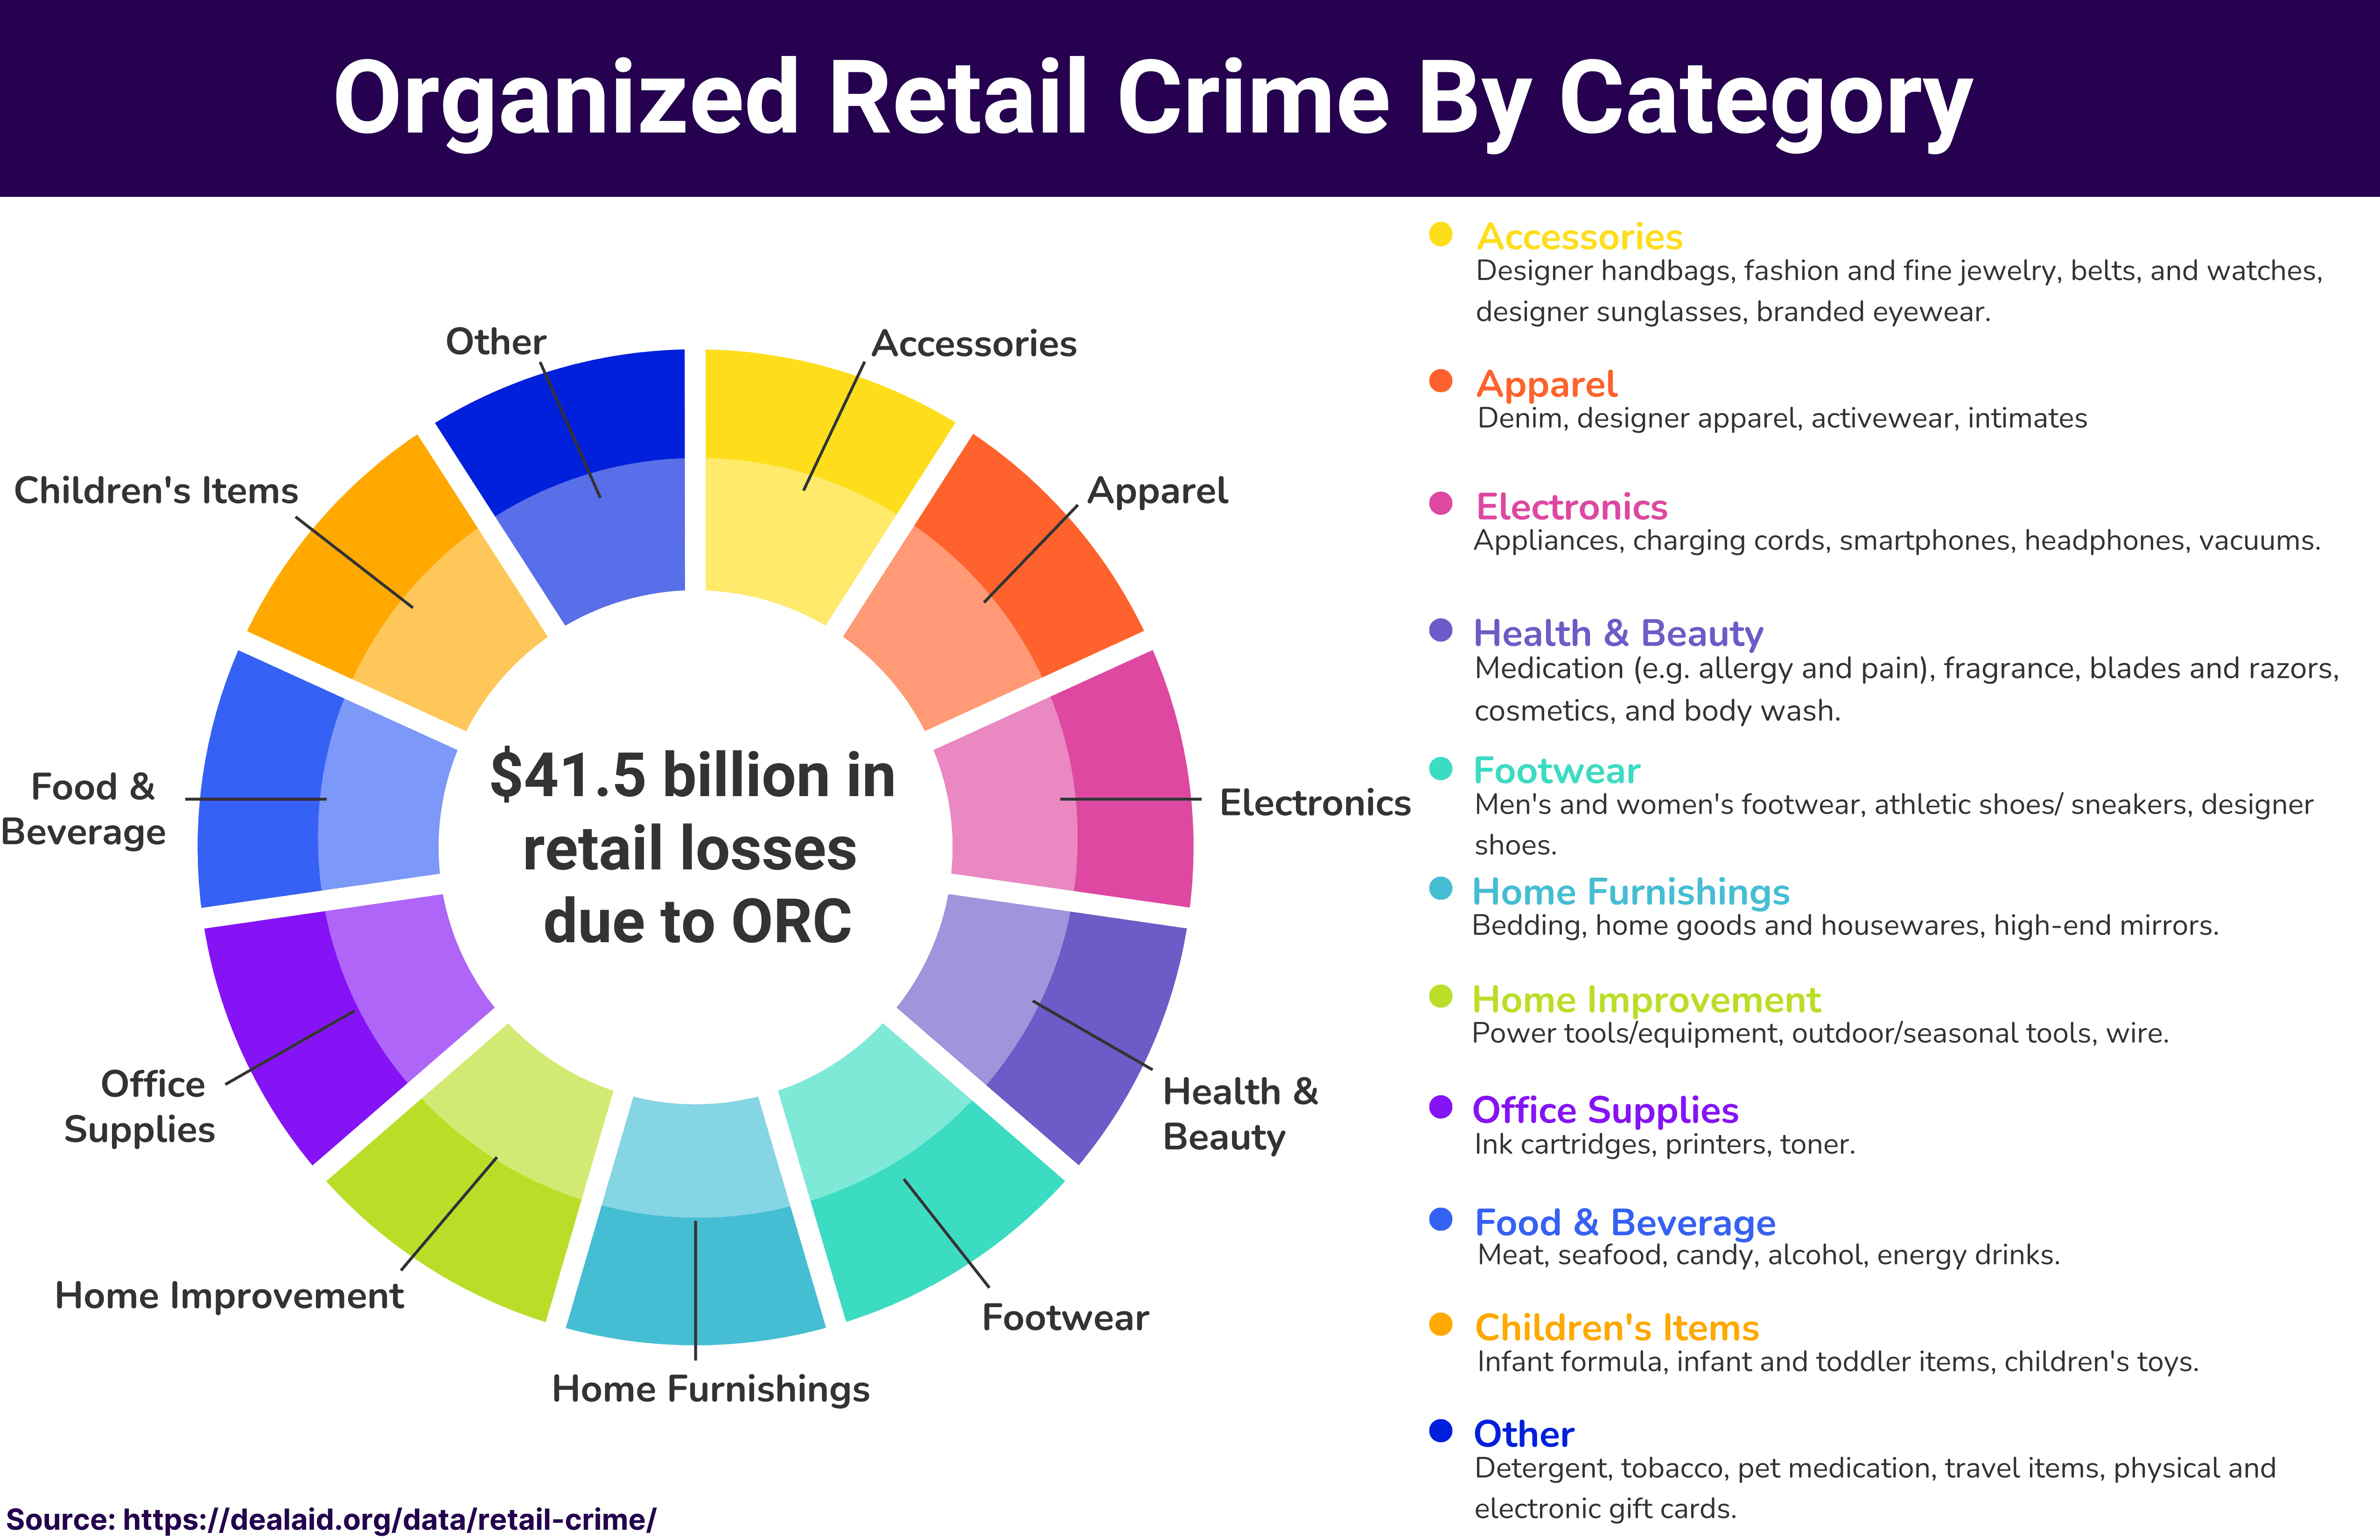
Organized retail crime and external theft cost US Retailers $41.5 billion in 2022.
81.2% of retailers saw an increase in violence and aggression associated with retail theft.
56% of small retail businesses in US experienced theft in the past year.
Over the past five years, average retail shrink rate has been 1.5%.
External theft including organized retail crime accounted for 37% of retail shrink last year.
Internal (employee) theft accounted for 28.5% of retail shrink last year.
46% of small retail businesses forced to increase prices as a result of theft.
Retail theft leads up to $14.9 billion in lost tax revenue in US every year.
1 in 11 Americans have admitted to shoplifting at least once in the past.
Organized Retail Crime Statistics
US retailers experienced an increase of organized retail crime by 26.5% last year.
68.5% of retailers in US don’t have Organized Retail Crime (ORC) prevention departments.
Retailers with an ORC team reported 3.3x more organized retail crime incidents than retailers without an ORC team.
68.9% of retailers reported that in-store fraud increased last year.
Most common type of retail fraud includes: gift card fraud; discount and loyalty fraud; return fraud; and payment fraud.
74.1% of retailers reported gift card related crimes in the past year.
95.1% of gift cards originating from retail crime end up being sold online.
Los Angeles has had the most reported organized retail crime incidents among all American cities in the past four years.
San Francisco, New York, Houston & Miami made the top five cities with most organized retail crime incidents in the past year.
50% of small retail businesses experienced more shoplifting last year than in years past.
Items most likely to be targeted by organized retail crime tend to be: concealable, removable, available, valuable, enjoyable and disposable (CRAVED).
Top categories affected by organized retail crime are: apparel, health & beauty, electronics, accessories, food & beverage, footwear, home furnishings, home improvement, eyewear, office supplies, infant care, toys and other.
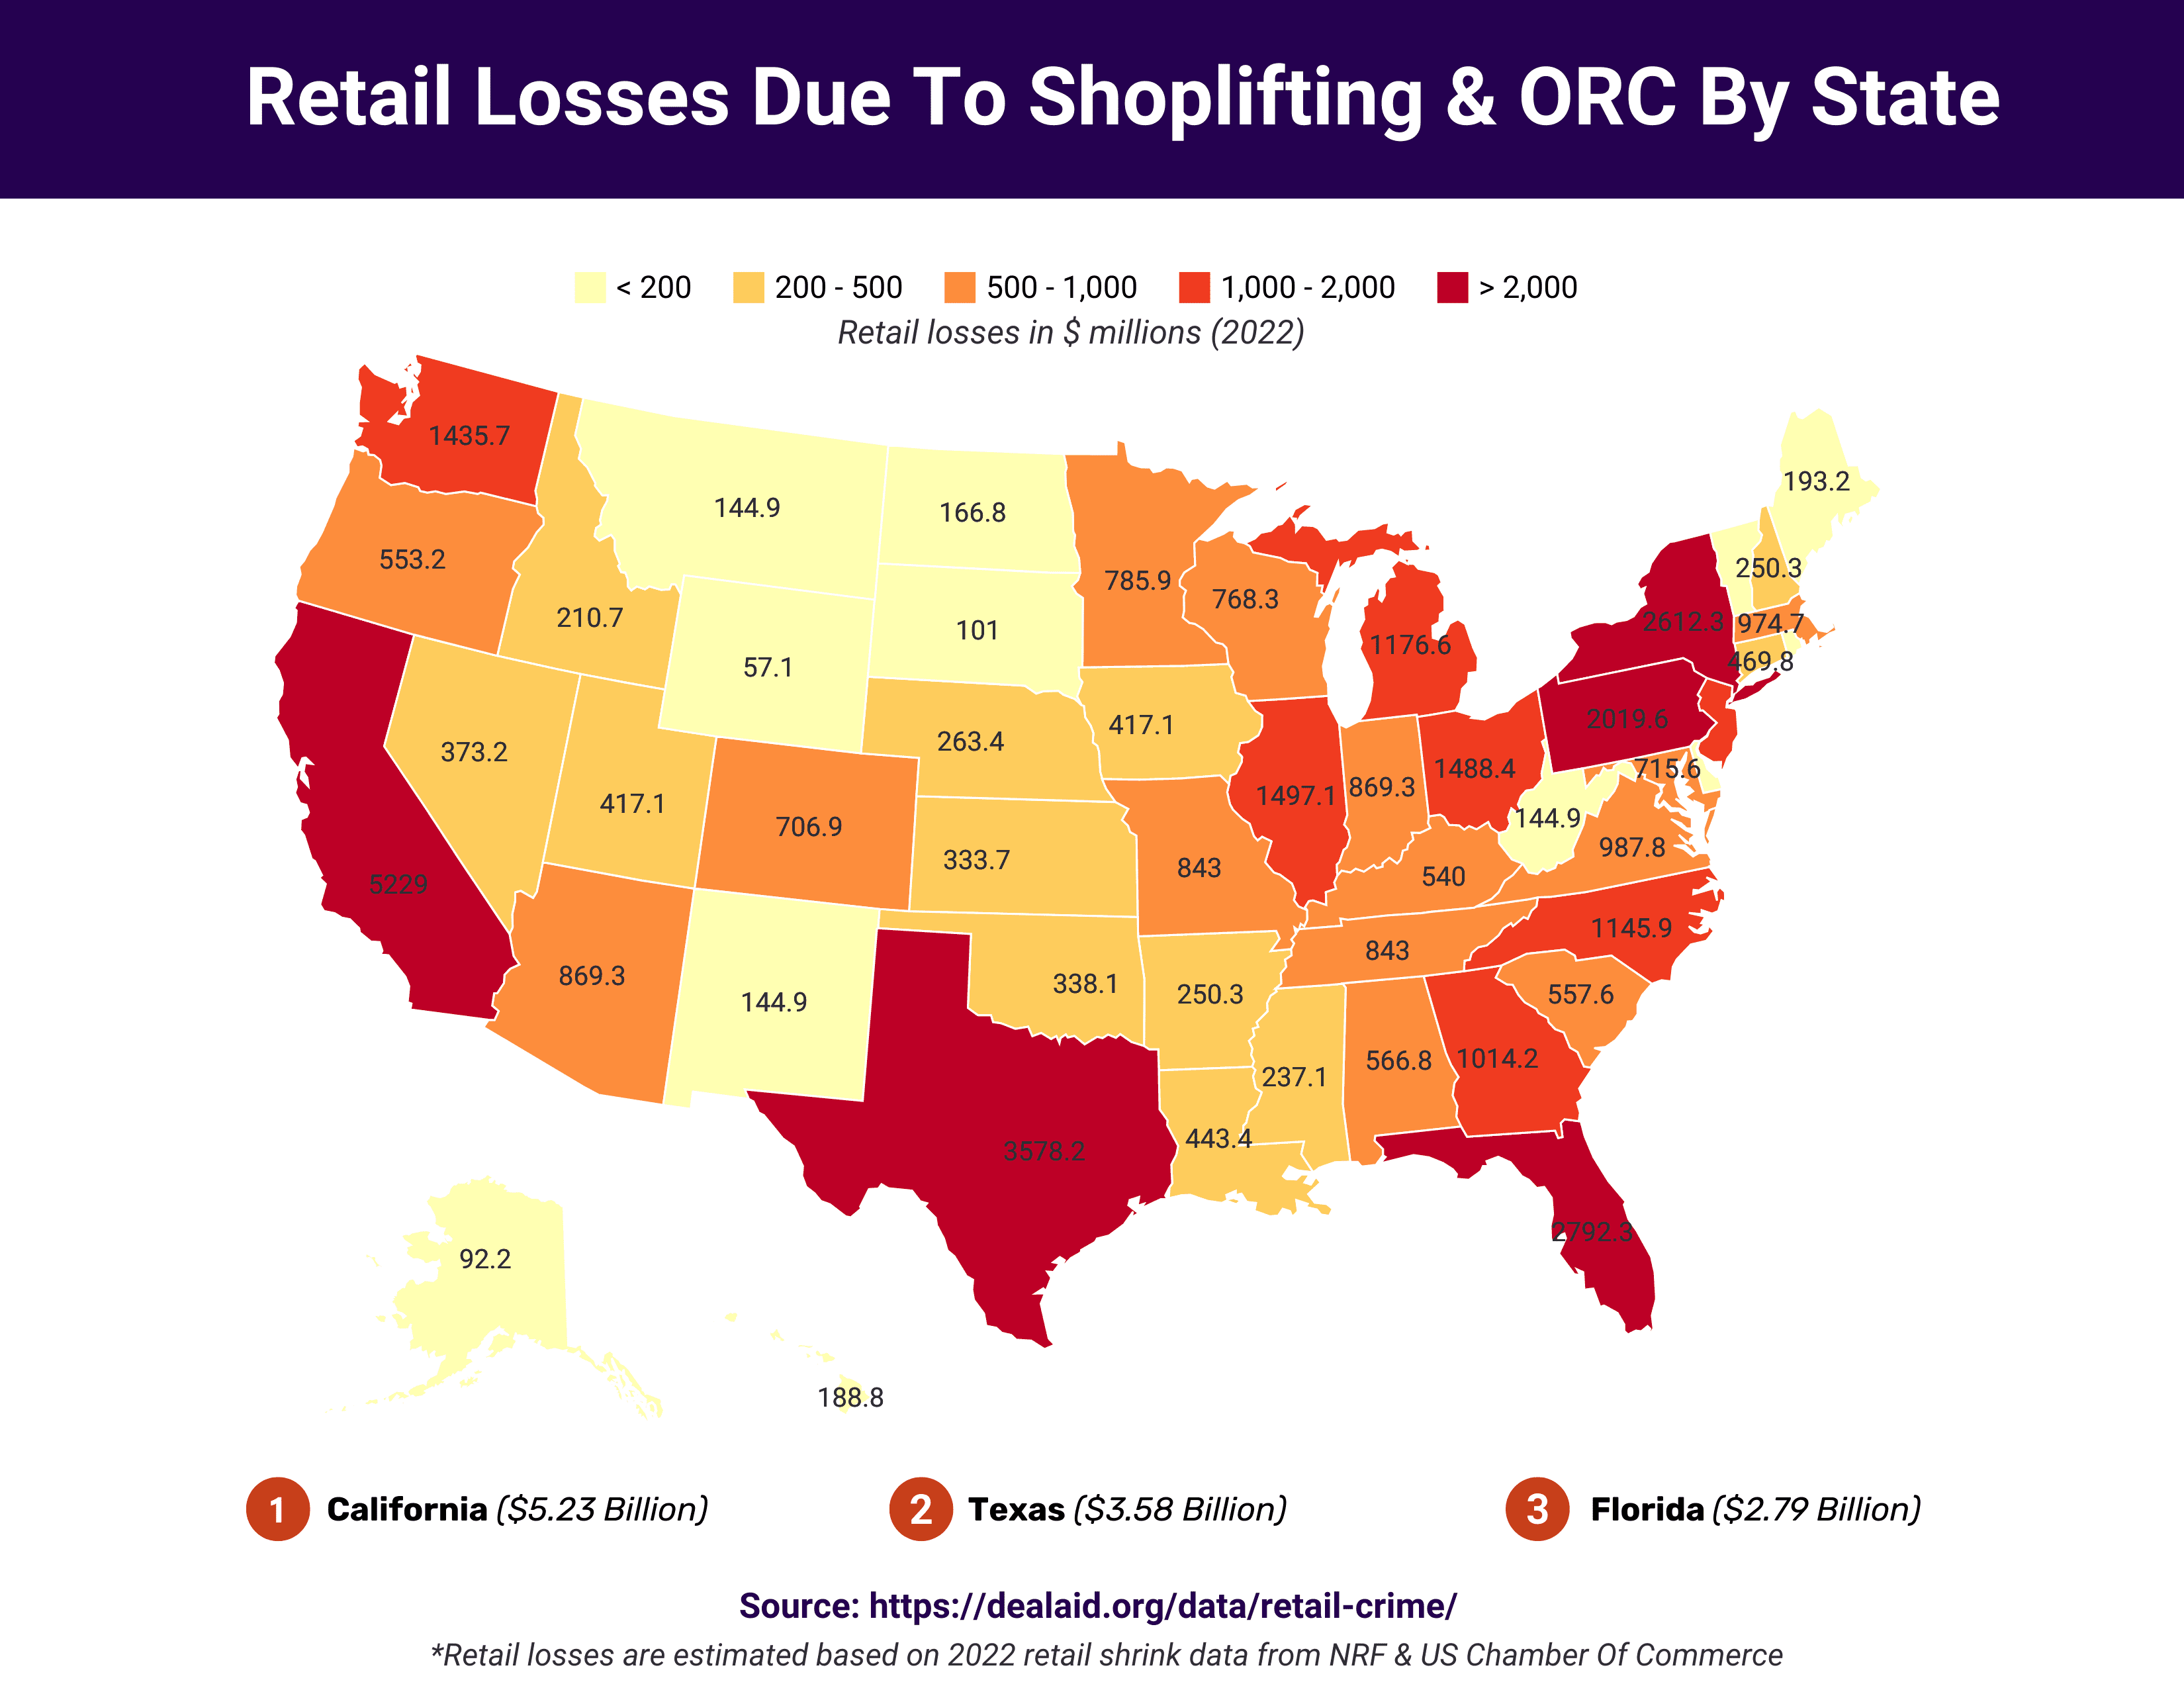
Retail Losses Due To External Theft By State (2022)
Retail losses due organized retail crime (ORC) and shoplifting increased by 18.7% YoY.
California had largest losses due to shoplifting and retail theft of $5.23 billion.
Texas had second highest losses due to shoplifting and retail theft of $3.58 billion.
Florida had third largest losses due to shoplifting and retail theft of of $2.79 billion.
New York State had fourth largest losses due to shoplifting and retail theft of $2.6 billion.
Pennsylvania eclipsed $2 billion in retail losses due to ORC in 2022 to $2.02 billion.
States with the lowest losses due to retail theft were DC ($43.9 million), Wyoming ($57.1 million), Alaska ($92.2 million) and South Dakota ($101 million).
Shoplifting By City
New York City had over 63,925 shoplifting incidents reported in 2022 with 45% increase in shoplifting complaints versus 2021.
Los Angeles had 15,445 shoplifting incidents reported in 2022 which represents a 44% increase from 2021.
San Francisco had about 2900 shoplifting incidents reported in 2022 despite a $950 misdemeanour threshold.
There were 2192 shoplifting incidents reported in Miami in 2022, while in 2023 that number is already 16.3% higher with 2550 shoplifting incidents through July.
Chicago recorded 8728 cases of retail theft in 2022 which was a 41% increase from 2021.
Houston had 10387 cases of shoplifting in 2022.
City
Shoplifting Incidents In 2022
New York City
63,925
Los Angeles
15,445
Philadelphia
14,200
Houston
10,387
Chicago
8,728
Phoenix
6,436
San Diego
3,078
San Francisco
2,900
Fort Worth
2,493
Boston
2,234
Miami
2,192
Denver
1,866
Louisville
1,678
Dallas
1,653
Austin
1,417
Portland
1,065
Internal Retail Theft Statistics
Internal & employee theft cost American retailers $26.93 billion last year.
Average value of internal and employee theft incident is almost 3x more than the average value of external theft incident, $1,551 versus $524.
88% of all internal & employee theft incidents included attempts to hide the crime.
Billing and non-cash theft represents 38% of all internal and employee theft cases.
The most common categories of internal and employee theft outside of cash/time are: electronics, clothing, office supplies and food & drink.
57% off all fraud cases are employee related.
Internal & employee theft has increased as a risk priority by 56.9% of retailers in the last five years.
22% of small business retailers reported incidents of employee theft.
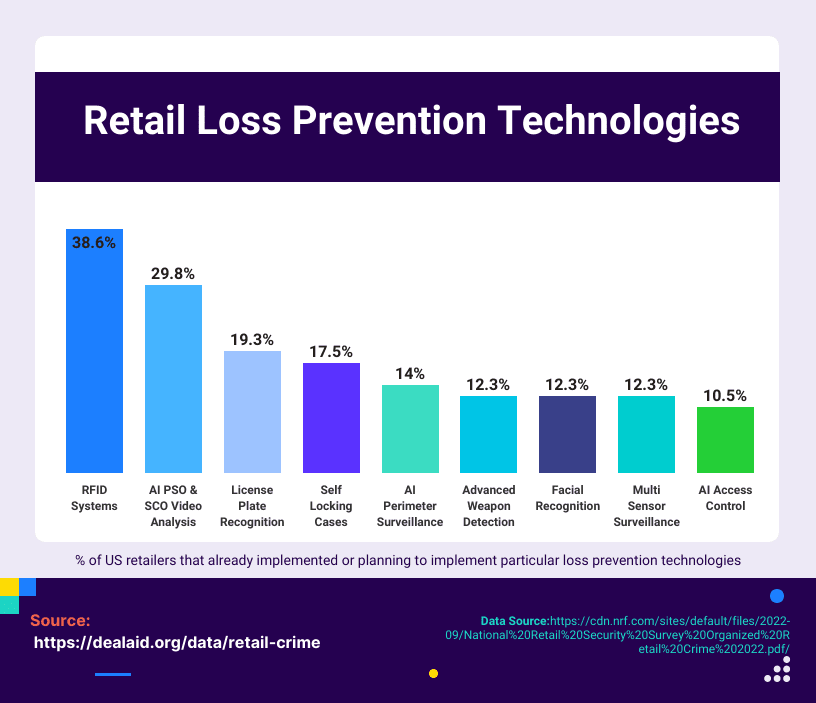
Retail Loss Prevention Statistics
37.1% of retailers increased the size of their loss prevention & asset protection teams in the last year.
44.5% of retailers increased spending on loss prevention & asset protection in the last year.
Technology (60.3%), capital/equipment (52.4%), other (42.9%) and guards (32.3%) were the loss prevention categories with largest increases in spending.
RFID systems (38.6%), AI POS/SCO video analytics (29.8%), license plate recognition (19.3%) and self service locking cases (17.5%) are the most popular loss prevention/asset protection technologies among retailers who are already implementing or planning to implement.
37.9% of retailers do not authorize any of their employees to apprehend shoplifters.
70.9% of retailers do not have a value threshold for persecuting retail crime incidents.
Average threshold value for retailers that persecute internal theft and fraud is $1650.
Average threshold value for retailers that persecute external theft and fraud is $655.
Only 31.5% of retailers have Organized Retail Crime dedicated teams with 17 team member average.
36% of small retail businesses have enhanced or implemented security features to combat retail theft.